OCI Block Volume monitoring
OCI Block Volume is a high-performance, scalable, and persistent block storage service provided by Oracle Cloud Infrastructure (OCI). It is designed to be attached to virtual machines (VMs) or bare-metal compute instances in OCI, functioning similarly to a traditional hard drive in a physical server.
Overview
OCI Block Volume monitoring is the process of tracking the performance, health, and usage of block storage volumes within Oracle Cloud Infrastructure (OCI). Site24x7’s integration with OCI Block Volume provides end-to-end monitoring of block storage volumes attached to OCI compute instances. With this integration, users can track essential metrics such as storage capacity, performance, I/O operations, and throughput, ensuring optimal volume performance and storage management.
The integration helps identify potential issues like high latency, insufficient storage capacity, or underutilized volumes, enabling proactive action to maintain smooth operations.
Use case
An organization running multiple virtual machines (VMs) on OCI relies on OCI Block Volumes for persistent storage. By integrating OCI Block Volume with Site24x7, the organization gains insights into the performance and usage patterns of their storage volumes.
For example, during a high-traffic period, Site24x7 detects increased latency and declining IOPS in a critical volume. It triggers an alert, prompting the admin to allocate additional resources to maintain performance and avoid disruptions. Site24x7's historical data also helps the admin review usage trends and plan for future storage needs efficiently.
Benefits of Site24x7’s OCI Block Volume integration
Site24x7's integration with OCI Block Volume provides you with the following benefits:
- Continuous tracking of volume performance (IOPS, throughput, latency) and utilization metrics ensures quick detection of potential issues.
- Preventing underutilization or overutilization of block volumes by providing insights into storage utilization trends.
- Minimizing downtime or performance degradation through real-time alerts for high latency or performance bottlenecks, which enable rapid response.
- Monitoring storage usage trends helps optimize resource allocation, avoiding unnecessary costs associated with over-provisioned or underutilized volumes.
Setup and configuration
- Site24x7 uses cross-tenancy access to monitor your resources using Site24x7's tenancy user. Log in to your Site24x7 account and create a specific policy to allow Site24x7 to view your resources without affecting your security.
- On the Add OCI Monitor page, select OCI Block Volume from the Services to be discovered list.
Permissions
Ensure that Site24x7 receives the following permissions to monitor the OCI Block Volume:
- listVolumeAttachments
- listBootVolumeAttachments - VOLUME_ATTACHMENT_INSPECT
- GetVolume
- GetBootVolume - VOLUME_INSPECT
Polling frequency
Site24x7 queries OCI service-level APIs according to the set polling frequency (from one minute to once a day) to collect metrics from an OCI Block Volume monitor.
Supported metrics
The supported metrics for an OCI Block Volume monitor are provided below:
| Metric name | Description | Statistics | Unit |
|---|---|---|---|
| Volume Read Throughput | Measure the total read throughput of the volume for given interval. | Mean | Bytes |
| Volume Write Throughput | Measure the total write throughput of the volume for given interval. | Mean | Bytes |
| Volume Read Ops | Measures the total activity level from I/O reads of the volume for given interval. | Sum | Reads |
| Volume Write Ops | Measures the total activity level from I/O writes of the volume for given interval. | Sum | Writes |
| Volume Throttled IOs | Measure the total sum of all the I/O operations that were throttled during a given time interval. | Sum | Count |
| Volume Guaranteed VPUs Per GB | Measures the rate of change for currently active VPUs/GB. | Mean | Count |
| Volume Guaranteed IOPS | Measures the rate of change for guaranteed IOPS per SLA. | Mean | IOPS |
| Volume Guaranteed Throughput | Measures the rate of change for guaranteed throughput per SLA. | Mean | MB |
Metadata
Site24x7 collects the following information about the OCI Block Volumes.
| Attribute | Description |
|---|---|
| Block Volume ID | The Block Volume ID of the volume. |
| Display Name | The Display name of the block volume. |
| Region | The Region where the block volume is deployed. |
| Auto Tune VPUs (GB) | The auto-tune feature for VPUs per GB, if enabled in the Oracle console. |
| Availability Domain | The availability domain of volume present. |
| Auto-tune Enabled | Indicates if auto-tune is enabled for Block Volume. |
| Hydrated | Indicates whether Block Volume is hydrated. |
| KMS Key ID | The ID of the Oracle managed key that was used to encrypt the block volume. |
| State | The current state of the Block Volume. |
| Size (GB) | The current size in GB of the Block Volume. |
| Size (MB) | The current size in MB of the Block Volume. |
| Created Time | The created time of the Block Volume. |
| Group ID | The ID of the volume group, if the Block Volume is attached to any group. |
| VPU per GB | The current VPU per GB value. |
Threshold configuration
To configure thresholds for an OCI Block Volume monitor:
- Log in to your Site24x7 account and navigate to Admin > Configuration Profiles > Threshold and Availability.
- Click Add Threshold Profile.
- Select OCI Block Volume from the Monitor Type drop-down menu and provide an appropriate name in the Display Name field.
- The supported metrics are displayed in the Threshold Configuration section. You can set threshold values for all the metrics mentioned above.
- Click Save.
Forecast
Estimate future values of the Volume Read Throughput, Volume Write Throughput, Volume Read Ops, Volume Write Ops, and Volume Throttled IOs metrics with the Forecast feature. Predict future points of these performance metrics (measurement of resource usage) based on historical observations and make informed decisions.
Licensing
The OCI Block Volume monitor is free.
Viewing OCI Block Volume monitor data
To monitor your Autonomous Database environment, log in to your Site24x7 account and navigate to Cloud > OCI > OCI Block Volume.
Monitor data
The monitor data for an OCI Block Volume monitor is given below.
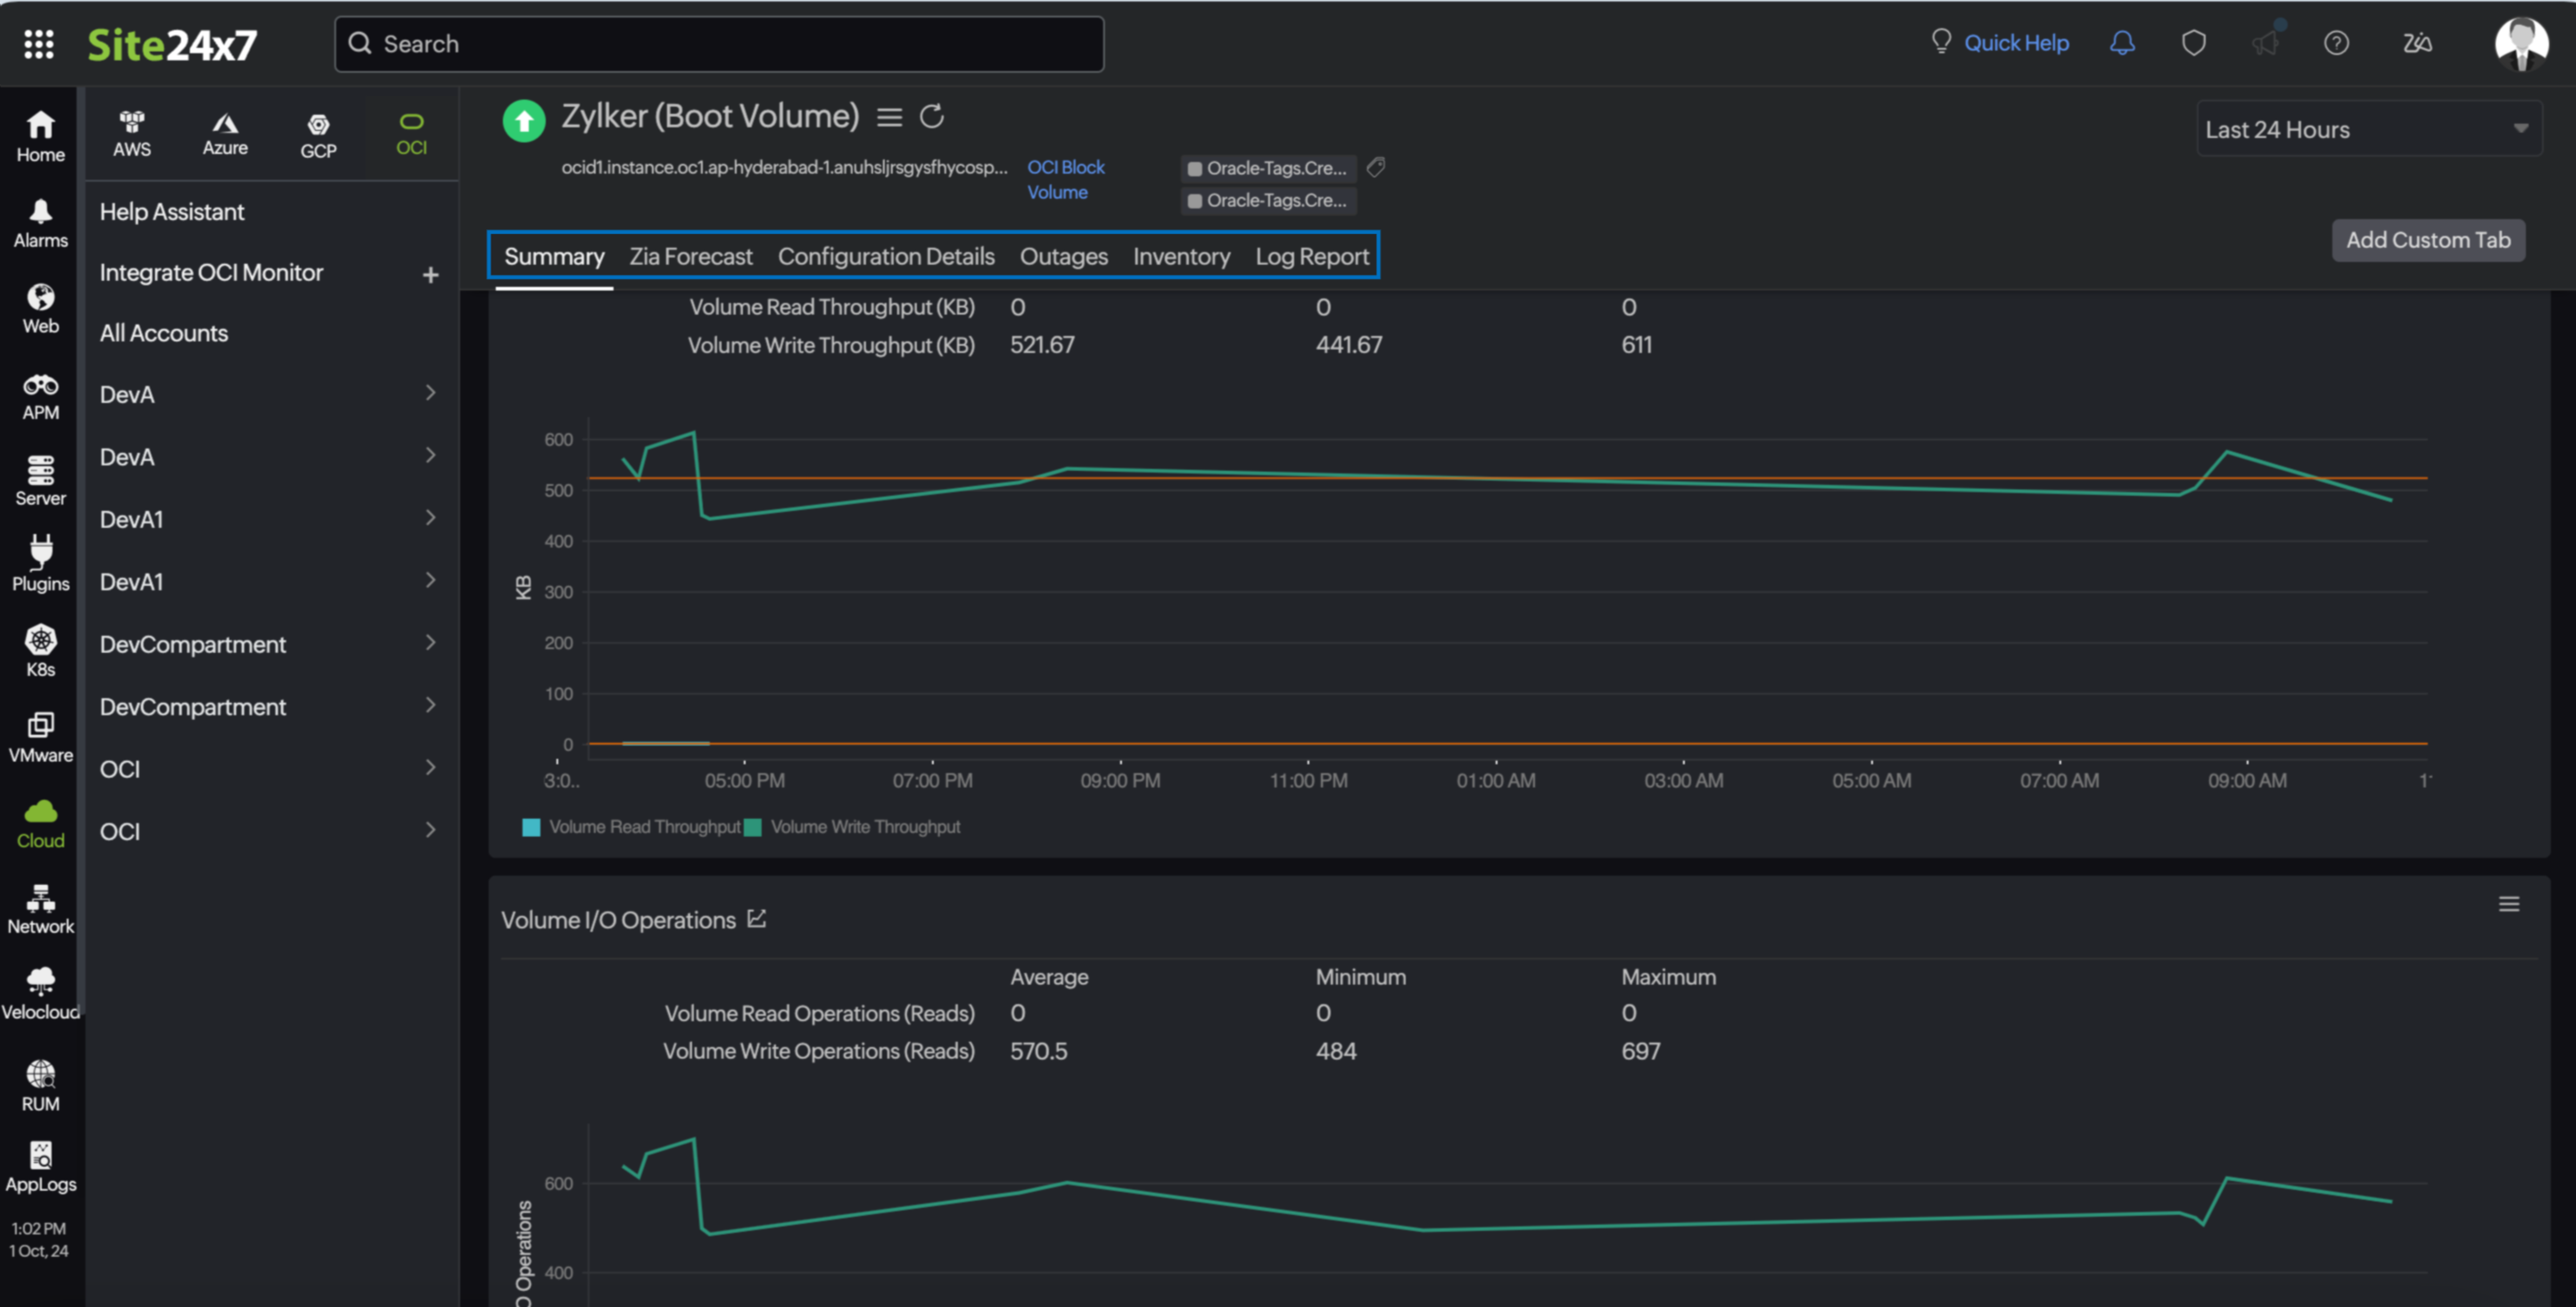
Summary
The Summary tab offers a comprehensive overview of the events timeline and metrics, presenting insightful charts that shed light on the performance of your OCI Block Volume monitor.
Configuration Details
The Configuration Details tab summarizes essential details of your OCI Block Volume, such as Volume ID, Region, Display Name, and Auto Tune VPUs.
Outages
The Outages tab provides details on an outage's start time, end time, duration, and comments (if any).
Inventory
Obtain details like Resource Name, Region, Monitor Licensing Category, and much more from the Inventory tab. The Threshold and Availability Profile and the Notification Profile can be set according to the user and viewed in this tab.
Log Report
This tab offers a consolidated report of the OCI Block Volume monitor's log status, which can be downloaded as a CSV file.
Related topics